Water Resource
Approach to Water Resource
Global water scarcity is one of the most important environmental issues today, along with the risks of climate change. Changes in rainfall, typhoons, and snowfall patterns due to climate change lead to droughts and floods, while population growth and urbanization are causing agricultural and drinking water shortages that are becoming more and more pronounced each year.
As the NIPPN Group is benefiting from the bounty of the earth, a shortage of the water resource can be a major risk. At each business site, we monitor the amount of water consumption (tap water, groundwater, and industrial water) and work to use it effectively and without waste.
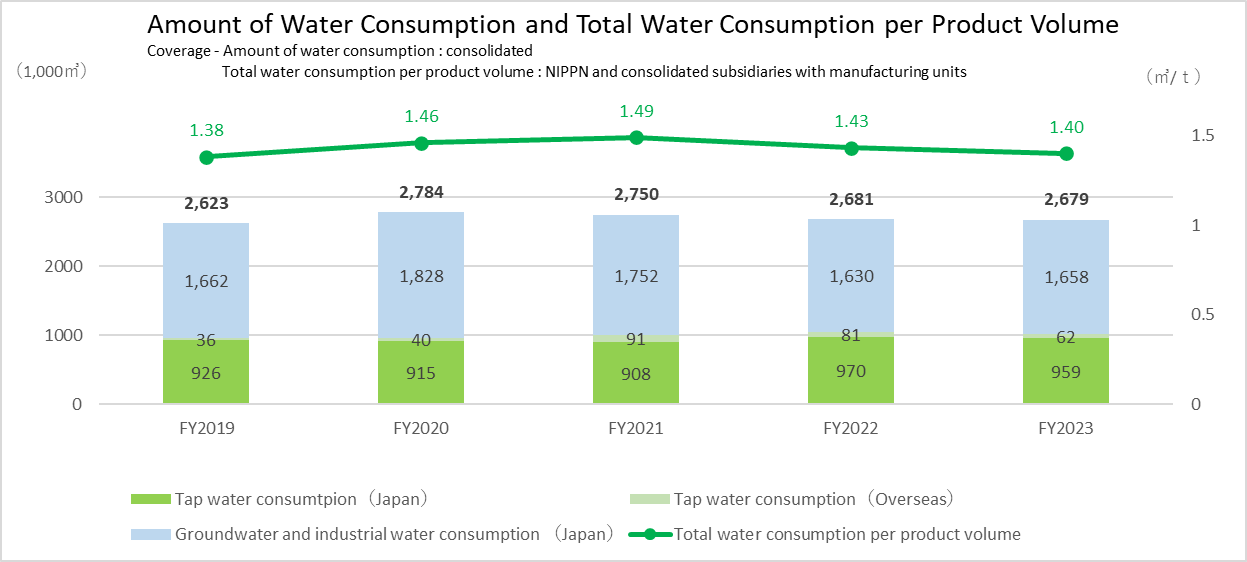
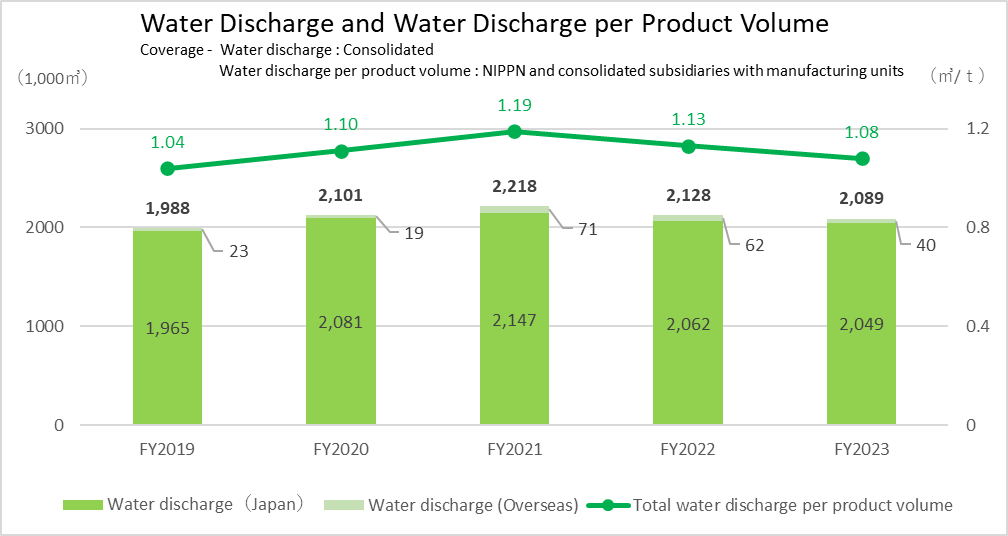
The Amount of Water Consumption and Water Discharge
| FY2019 | FY2020 | FY2021 | FY2022 | FY2023 | ||
|---|---|---|---|---|---|---|
| Tap water consumption (1.000m3) | Japan | 926 | 915 | 908 | 970 | 959 |
| Overseas | 36 | 40 | 91 | 81 | 62 | |
| Groundwater and industrial water consumption (1,000m3) | Japan | 1,662 | 1,828 | 1,752 | 1,630 | 1,658 |
| Total Water consumption (1,000m3) | Japan and overseas | 2,623 | 2,784 | 2,750 | 2,681 | 2,679 |
| Water consumption per product volume (m3/t) | 1.38 | 1.46 | 1.49 | 1.43 | 1.40 |
| FY2019 | FY2020 | FY2021 | FY2022 | FY2023 | ||
|---|---|---|---|---|---|---|
| Water discharge (1,000m3) | Japan | 1,965 | 2,081 | 2,147 | 2,062 | 2,049 |
| Overseas | 23 | 19 | 71 | 67 | 40 | |
| Japan and overseas | 1,988 | 2,101 | 2,218 | 2,128 | 2,089 | |
| Water discharge per product volume (m3/t) | 1.04 | 1.10 | 1.19 | 1.13 | 1.08 |
Water Risks Assessment
To assess the impact of water risks on business continuity, we regularly assess water risks at our procurement of raw materials and manufacturing sites in Japan and overseas (37 sites in 4 countries) using Aqueduct (Ver. 4.0), a global water risk mapping tool published by the World Resources Institute (WRI), an international environmental NGO, that evaluates global water risks of each location based on its latitude and longitude. Within in our raw material procurement, we are aware of the high water risks in Australia.
| Country | Total Score |
|---|---|
| Japan | 1.97 |
| Canada | 1.23 |
| USA | 2.60 |
| Australia | 2.91 |
In our assessment, we consider the water risks at our manufacturing sites in Japan to be low. We are aware that water risks are high at our overseas manufacturing sites in China and Thailand, but since we do not use large amounts of water for manufacturing, we do not consider this to be a major concern.
| Water risks level | Number of business sites | Amount of water consumption | Production volume | ||
|---|---|---|---|---|---|
| 1,000m3 | Ratio | 1,000t | Ratio | ||
| Low (<10%) | 2 | 61.1 | 2.3% | 101.1 | 5.4% |
| Low-Medium (10-20%) | 12 | 982.6 | 37.5% | 585.4 | 31.2% |
| Medium-High (20-40%) | 21 | 1,567.5 | 59.8% | 1,166.6 | 62.2% |
| High (40-80%) | 1 | 7.0 | 0.3% | 17.8 | 0.9% |
| Extremely High (>80%) | 1 | 0.8 | 0.0% | 3.4 | 0.2% |
Efficient Use of Water Resources
Our Group is committed to water conservation by reducing water consumption, raising employee awareness, and promoting water conservation awareness through environmental education. Even when wastewater treatment is necessary, we use methods that have minimal environmental impact and strive to make effective use of water resources.
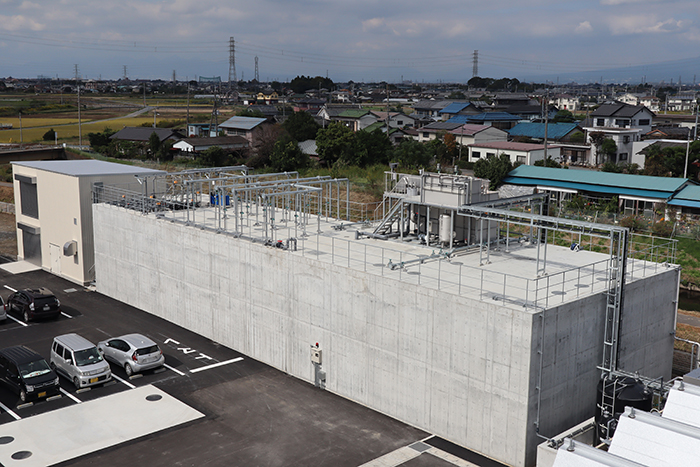
Water discharge treatment facility at Isesaki Frozen Food Plant