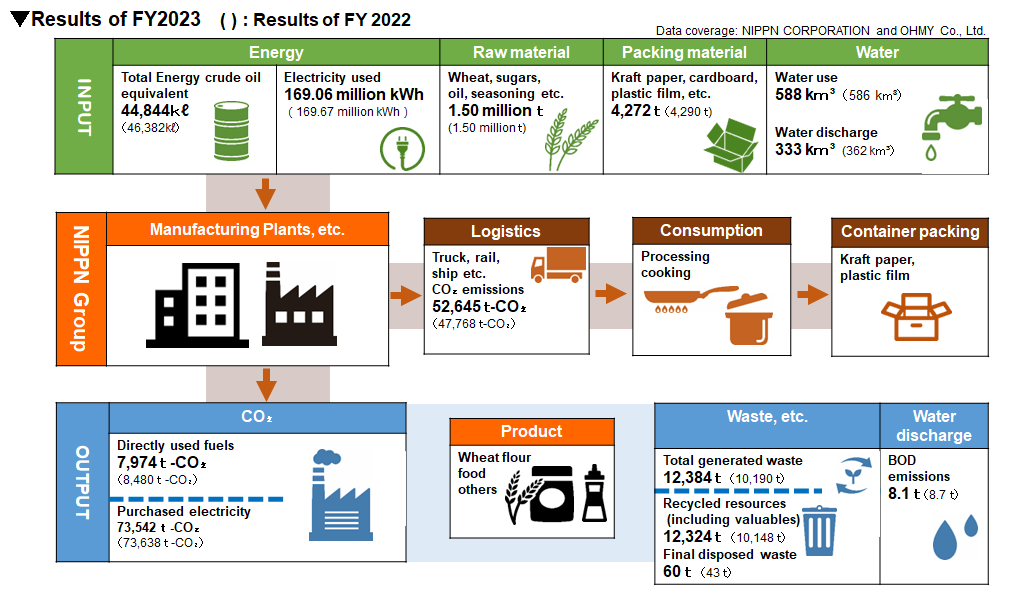
Material Balance
We strive to understand and reduce our environmental impact at every stage of our business processes, including "raw material procurement", "manufacturing", and "shipping".
FY2023 Results
Results for the last 3 years
Scope: All business sites in Japan and Overseas.
INPUT
| FY2021 | FY2022 | FY2023 | |
|---|---|---|---|
| Total energy input | |||
| Total energy input [TJ] | 3,265 | 3,375 | 3,313 |
| Total energy input per product volume [TJ/1,000t] | 1.75 | 1.79 | 1.73 |
| Fossil fuels [TJ] | 808 | 857 | 857 |
| Electricity [TJ] | 2,457 | 2,518 | 2,456 |
| Total materials input | |||
| Total materials input [1,000t] | 1,780 | 1,796 | 1,827 |
| Water resource input | |||
| Water resource input [1,000㎥] | 2,750 | 2,681 | 2,679 |
| Water resource input per product volume [1,000㎥/1,000t] | 1.49 | 1.43 | 1.40 |
| Tap water [1,000㎥] | 999 | 1,052 | 1,021 |
| Industrial water [1,000㎥] | 212 | 138 | 511 |
| Groundwater [1,000㎥] | 1,540 | 1,492 | 1,146 |
OUTPUT
| FY2021 | FY2022 | FY2023 | |
|---|---|---|---|
| Emissions | |||
| Scope 1 & 2 : Total CO₂ emissions [1,000t-CO₂] | 158 | 162 | 162 |
| Total of Scope 1 : Fossil fuels [1,000t-CO₂] | 45 | 47 | 47 |
| Breakdown : City gas [1,000t-CO₂] | 31 | 32 | 34 |
| Breakdown : Other fossil fuels [1,000t-CO₂] | 14 | 15 | 12 |
| Total of Scope 2 : Electricity [1,000t-CO₂] | 113 | 115 | 115 |
| CO₂ per product volume [t- CO₂/1,000t] | 84.8 | 86.0 | 84.7 |
| Total product manufactured and sold [1,000t] | 1,821 | 1,843 | 1,874 |
| Water discharge | |||
| Total water discharge [1,000㎥] | 2,218 | 2,128 | 2,089 |
| Water discharge per product volume [㎥/1,000t] | 1.19 | 1.13 | 1.08 |
| Sewer [1,000㎥] | 1,683 | 1,532 | 1,467 |
| River [1,000㎥] | 502 | 567 | 593 |
| Sea [1,000㎥] | 32 | 30 | 30 |
| Generated waste | |||
| Total generated waste [1,000t] | 41 | 45 | 47 |
| Total generated waste per product volume [kg/t] | 21.6 | 23.5 | 23.7 |
| Final disposal volume [t] | 2 | 2 | 2 |
| Others (Non-Consolidated) | |||
| Scope 3 : CO₂ emissions from product transportation [1,000t-CO₂] | 49 | 48 | 53 |
| Containers and packing waste after product use [1,000t] | 4 | 4 | 4 |